Longevity is surrounded by high expectations, but the critical questions remain: how will digital longevity solutions generate revenue, and what is the actual size of the opportunity? Multiple analyst forecasts point to a sizeable and fast-growing market, yet estimates vary widely.
Because boundaries are fuzzy, market size estimates vary widely. A pragmatic way to read the market is: (1) a broad TAM anchored in digital health and ageing-related technologies, (2) a focused SAM for solutions purpose-built for longevity (e.g., biological age testing, risk-reduction programs, digital biomarkers, age-in-place tech), and (3) a SOM representing realistic capture by companies operating these models.
1) Total Addressable Market (TAM): the outer ring
- Digital health remains the best, measurable proxy for the outer boundary: Grand View Research estimates USD 289B in 2024, growing to USD 946B by 2030 (~22% CAGR). This includes telehealth, mHealth, wearables, e-prescription, and related infrastructure.
- Ambient assisted living & smart home - a key “age-tech” adjacency enabling prevention and independent living is estimated at USD 132B in 2024, projected to USD 645B by 2030 (30.8% CAGR). While not all of this is “longevity,” it underlines the scale of technology spend tied to ageing. Takeaway: By 2030, the broader, technology-enabled longevity TAM plausibly sits in the high hundreds of billions of dollars when adding up digital health core plus ageing adjacencies. TAM is too big to be directly useful for operators without a sharper cut.
2) Serviceable Addressable Market (SAM): digital longevity proper Narrowing from the outer ring:
- “Longevity market” (as a distinct category combining diagnostics, prevention programs, therapies and services targeting ageing) is projected by Market Research Future to reach ~USD 63B by 2035. This figure is useful as a long-range anchor for the field’s purpose-built products and services.
- Digital biomarkers, critical for measuring ageing trajectories and intervention impact, are projected to grow from ~USD 3.4B in 2023 to ~USD 14B by 2030 (~22.7% CAGR). This is one of the most “pure-play” digital longevity sub-segments with measurable budgets.
- Capital formation is rebounding: sector financing tracked by Longevity.Technology reached USD 8.49B across 331 deals in 2024, a useful indicator for near-term commercialization capacity even if not directly convertible to revenue.
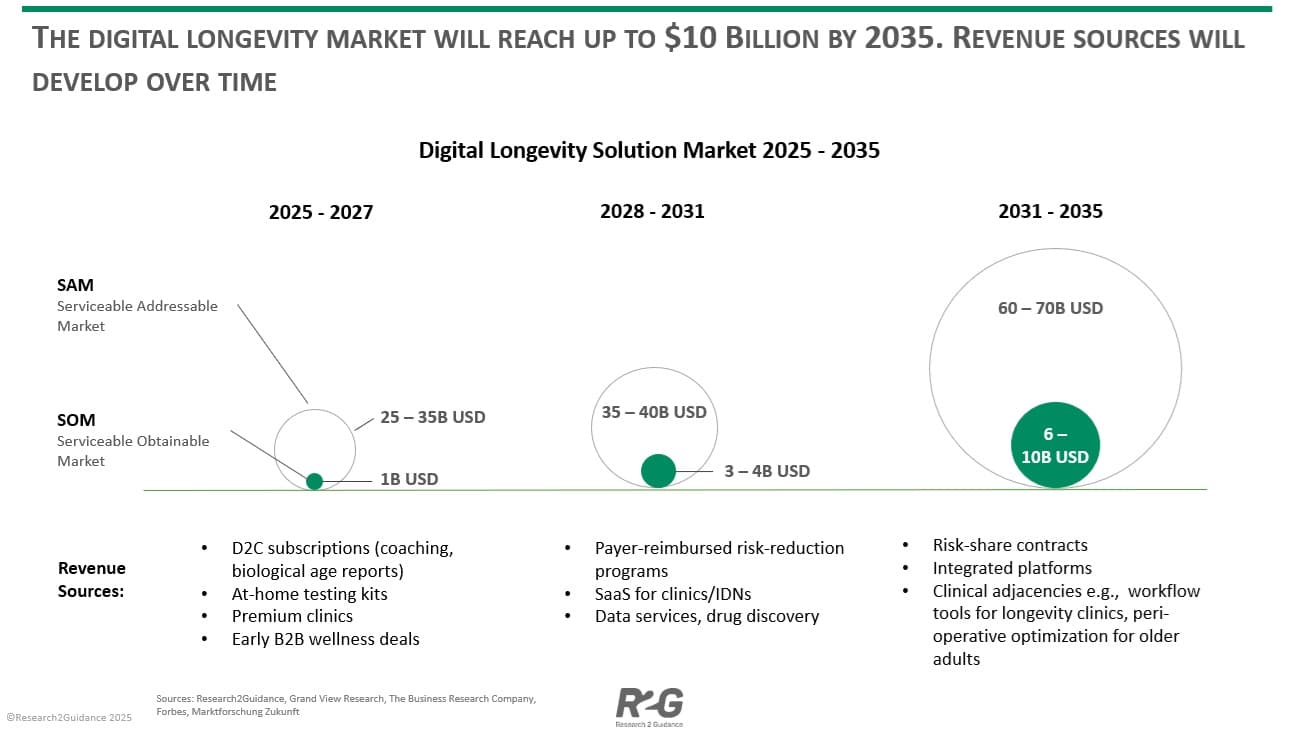
Working SAM (2025–2035): Combining the longevity-specific market anchor (~USD 63B by 2035) with high-growth digital sub-segments (e.g., digital biomarkers) and age-in-place technologies, a reasonable** digital longevity SAM** spans ~USD 25–35B near term (2025–2030), expanding toward ~USD 60–70B by 2035. The lower bound is conservative and excludes large swathes of general digital health spending that are not explicitly longevity-oriented.
3) Serviceable Obtainable Market (SOM): what leaders can plausibly capture The obtained share will depend on reimbursement, clinical validation and distribution partnerships. Benchmarks from adjacent digital health categories (SaaS + device + services) suggest that category leaders can capture 5–15% of a well-defined SAM over a decade.
- 2025–2027: With early evidence and cash-pay models dominant, a 5% share of a ~USD 25B SAM implies ~USD 1.2B aggregate SOM across leading players.
- 2028–2031: As payers/employers reimburse risk-reduction programs and digital biomarkers, a ~10% share of a ~USD 35–40B SAM implies ~USD 3.5–4B SOM.
- 2032–2035: With deeper health-system integration and risk-sharing contracts, 10–15% of a ~USD 60–70B SAM implies ~USD 6–10B SOM. Unit-economics reality check. Premium concierge programs today price USD 8,000–19,000 per member per year (e.g., Human Longevity’s clinic), illustrating current willingness to pay in cash-pay segments and setting a ceiling for “full-stack” offerings. As models move from luxury to reimbursed prevention, ARPU will fall but scale will rise.
4) Outlook to 2035: three phases and what changes in each Phase I — Cash-pay traction & evidence building (2025–2027) Revenue mix: D2C subscriptions (coaching, biological age reports), at-home testing kits, premium clinics, and early B2B wellness deals. Keys to win:
- Demonstrate outcome proxies (sleep, VO2max, glycemic variability) while building longitudinal datasets.
- Publish validation for digital biomarkers and composite “biological age” scores to prepare for payer scrutiny.
Phase II — Reimbursement & enterprise integration (2028–2031) Revenue mix:
- Payer-reimbursed risk-reduction programs for cardio-metabolic and frailty endpoints.
- SaaS for clinics/IDNs: longitudinal risk dashboards, digital twin simulation, and patient stratification.
- Data services: de-identified datasets licensed for drug discovery and actuarial modeling.
Catalysts:
- Maturing standards for digital measures as digital biomarkers scale toward a high-teens billion market by 2030.
- Convergence with ambient assisted living and remote monitoring broadens distribution into the home.
Phase III — Risk-sharing & platform consolidation (2032–2035) Revenue mix:
- Risk-share contracts with payers and self-insured employers, tying revenue to avoided claims and delayed onset of chronic disease.
- Integrated platforms bundling: continuous measurement (wearables/ambient), adaptive coaching, periodic diagnostics, and specialist escalation.
- Clinical adjacencies: workflow tools for longevity clinics, peri-operative optimization for older adults, and remote rehab/frailty programs.
5) Implications for operators and investors
- Define your SAM precisely. Avoid hiding behind the trillion-dollar digital health TAM. Pick the sub-segments where clinical evidence and procurement pathways exist (e.g., metabolic risk reduction, falls prevention, frailty).
- Treat measurement as a product. The digital biomarkers market’s growth suggests buyers will pay for reliable measurement, not just coaching—especially when it supports reimbursement and risk contracts.
- Bridge cash-pay to payer-pay. Use premium offerings (high ARPU, lower scale) to finance evidence generation and expand into reimbursed programs (lower ARPU, higher scale). Real-world price points from concierge clinics provide a ceiling for premium tiers today.
- Design for the home. The acceleration of ambient assisted living and smart home categories indicates distribution will increasingly be in-home—via sensors, automation, and passive monitoring rather than clinic-only touchpoints.
Bottom line Different analysts disagree on the outer size of the longevity opportunity, but a cautious, decision-useful picture emerges:
- TAM (outer ring): Hundreds of billions by 2030 when combining digital health and ageing-tech adjacencies. Grand View Research+1
- SAM (longevity-specific digital solutions): Building from the mid-tens of billions today toward ~USD 60–70B by 2035, consistent with long-range “longevity market” projections and the rapid growth of digital measurement. Marktforschung ZukunftGrand View Research
- SOM (capturable share): USD 1–2B (2027) → USD 3–4B (2031) → USD 6–10B (2035) for the set of leaders that convert evidence into reimbursement and risk-sharing at scale. For teams planning the next decade, the priority is not arguing over TAM—it’s owning a measurable outcome, a validated metric, and a distribution channel into the home.
Investor pitching event for digital longevity solution vendors: Do you offer a digital longevity solution and plan to raise funding for your next growth stage? Apply to the R2GConnect Online Pitching Event to showcase your innovation to leading global investors. Date: 23rd of September (via Zoom), 4:30 PM CEST Application Deadline: 18th of September Apply now: here